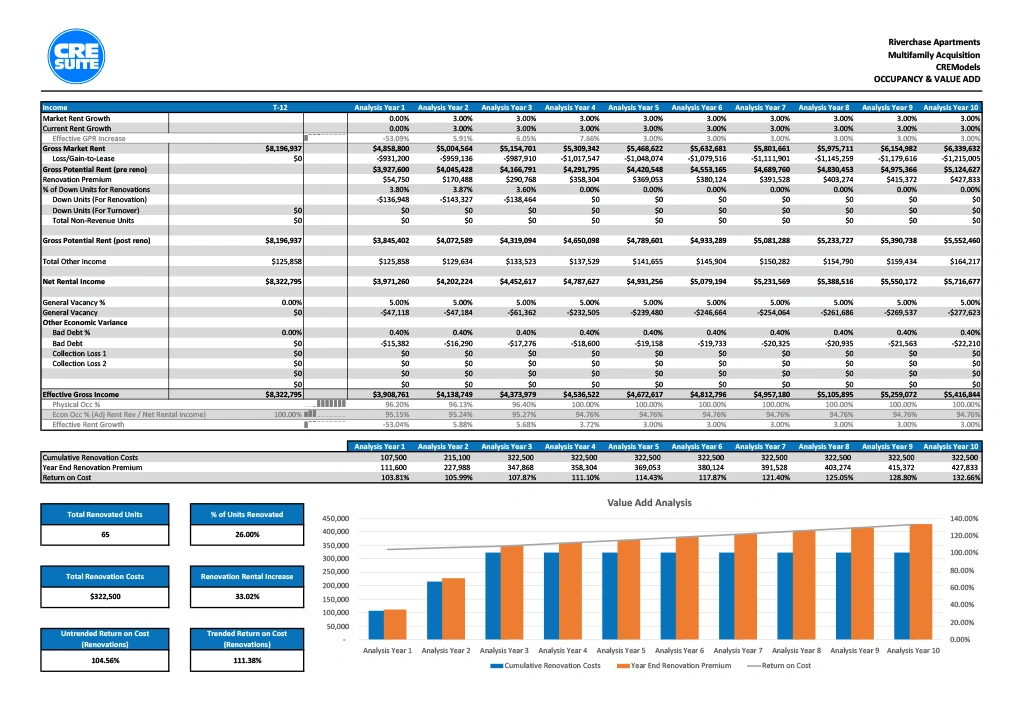
This table breaks down the metrics of collecting rent on a value-add property:
• What are our rental numbers?
• What numbers can be achieved if this property commands market rates?
• What are we losing from leases in place not at market rate?
• As units are scheduled for reno and closed down temporarily, how much are we losing during that time period?
• Once reno’s are done, what’s the rental spike?
• Displays how economic occupancy compares to physical occupancy.
Same information as chart at bottom right, but in numerical form.
This chart shows the cumulative costs to add value to the property (either through normal upgrades or renovating a distressed property) and increase rents. It displays those costs and cumulative premiums.
These isolate the returns specifically for the value-add components of a multifamily asset. Carving these out from the whole project - which may include units already renovated and already achieving market rents - is a special metric our software offers. Use it to zoom in on the effect of renovation investments.
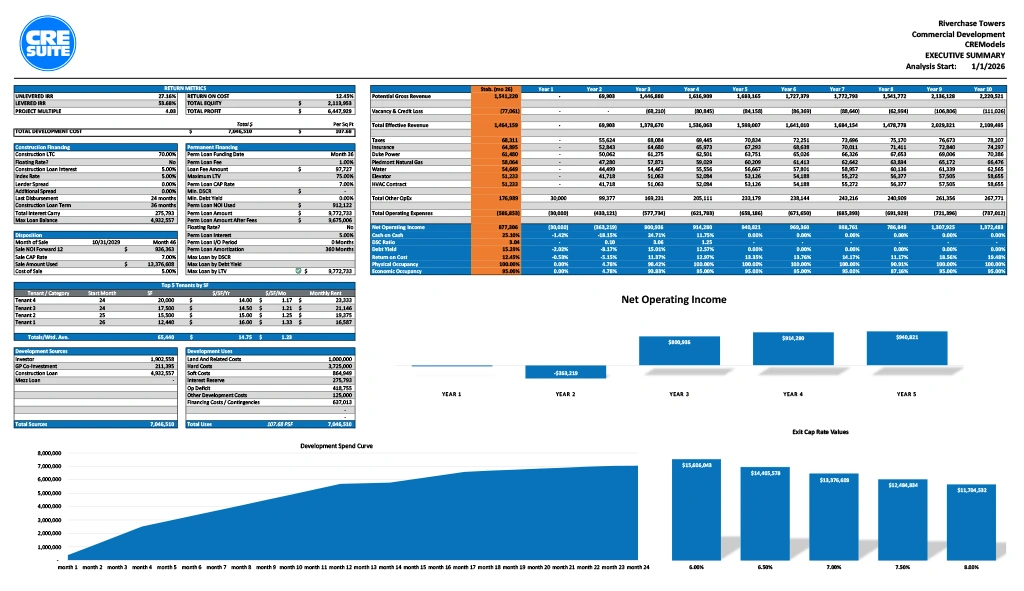
The orange column displays the development’s stabilized cash flow, once the project is done and tenants are occupying spaces. The columns to the right of the orange column show the timeframe of when the annual return metrics hit desired targets.
Easily view both Sources and Uses. For example, compare how a development’s soft costs like permitting and design compare to the hard costs of the build itself. Use this to get clarity on where funds are being spent on a development.
Use this chart to view the timing of expenditures throughout the development. Gain perspective on the chronological sequence of spending. This chart identifies when large spending will occur and can help identify atypical jumps or front loading that affects interest reserve.