Logo/Branding
Showcase your own brand: easily insert your logo and implement your brand standards throughout your accounts
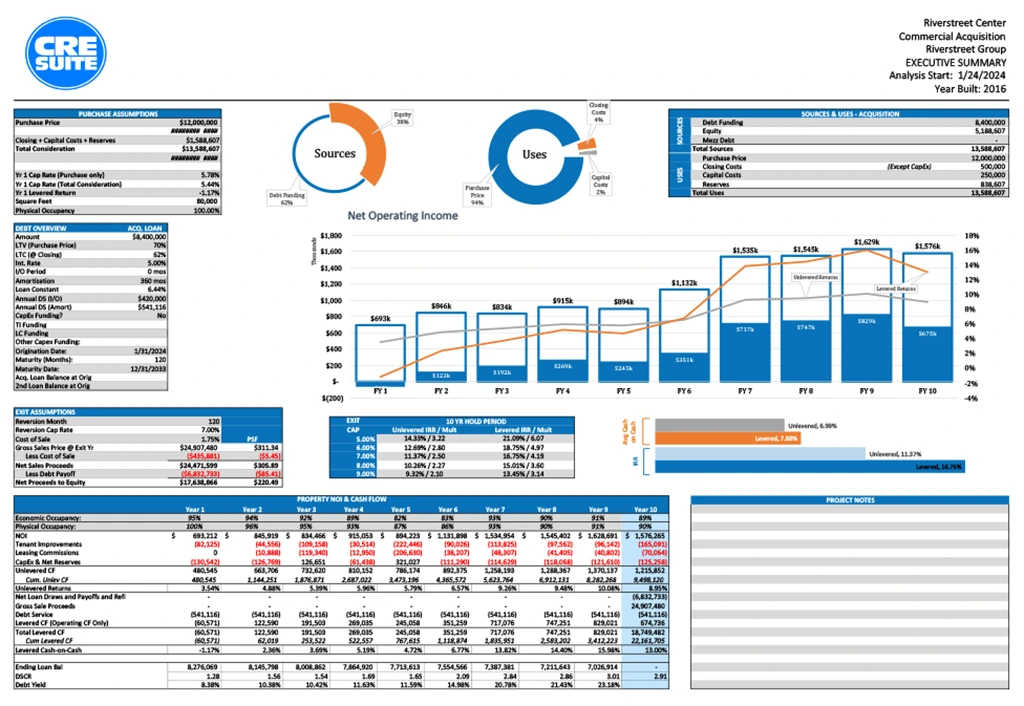
NOI Chart
Shows (in solid bars) the cash flow available for distribution, and (in white bars) is the project’s Net Operationg Income (NOI). Orange line is levered cash-on-cash, while the gray line is unlevered cash-on-cash. All of which show return expectations and growth over the hold period.
Property NOI & Cash flow
Nonstop Updates
View the asset’s annual returns in this table. See the results of the investment strategy in a 10 year projection.
Use this table to answer these questions:
- What is my cash-on-cash?
- Will this deal move forward?
- Will investors and/or lenders support this deal?
Debt Service Coverage Ratio
24/7 Dedicated Support
Review debt coverage ratio and debt yield and assess the project’s ability to sustain debt payments.